Hello guys, welcome back to our blog. Here in this article, we will discuss the top 10 debugging tools for software engineers in 2022, which tool will be the best and we will share different tools for various programming languages.
If you have any electrical, electronics, and computer science doubts, then ask questions. You can also catch me on Instagram – CS Electrical & Electronics.
Also, read:
- Top 14 Websites To Download Source Code For Free
- What Is SDLC, Software Development Life Cycle, Working Steps
- Top 12 Tech Parks In The World, Best Tech Parks For Engineers
Debugging Tools For Software Engineers
A bug occurs when there is a defect in the logic that was coded or in the implementation. A debugger is a software development tool that aids in identifying code errors. The error can then start to be revealed. We begin using debuggers very early in our development careers to hasten the correction of our logical errors.
A software program known as a debugging tool enables you to debug a program without recompiling it or altering its source code. Debugging tools enable programmers to attempt a fix without having to change the source code.
When a programming error occurs or changes need to be made before a program is released, debugging tools are frequently used by programmers. Troubleshooting issues with other applications, such as operating systems and web browsers, can benefit from the use of debugging tools.
Today’s sophisticated tools enable you to troubleshoot problematic code running on a different device as if it were local code. The best part is that these remote debugging tools improve collaboration between development teams in addition to addressing debugging challenges.
17. LLDB
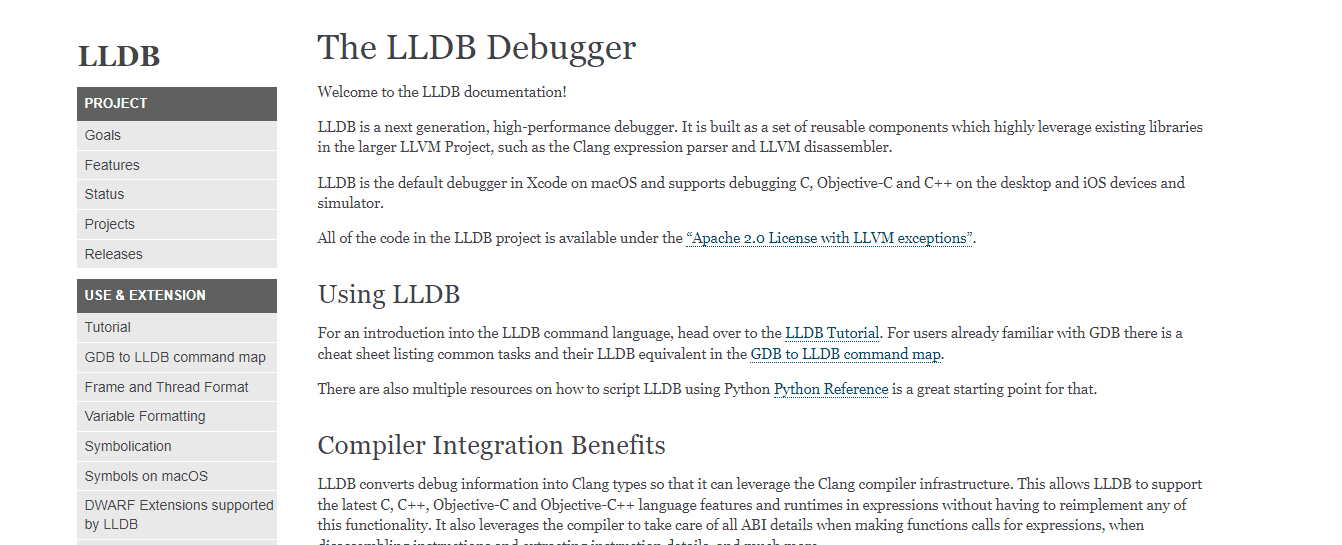
The LLDB debugger, which supports C, Objective-C, and C++ for desktop and iOS devices, is the default debugger for XCode for macOS. Additionally, this debugger features extensions that make it scriptable in Python. If you are already familiar with GBD, you can apply what you already know because the command syntax is conceptually identical.
Incorporated into the compiler, LLDB features a built-in command-line tool, remote debugging capabilities, the ability to insert breakpoints, and disassembly capabilities. By doing this, you can debug your code without having to recompile it every time you run your program. The data logs are extremely effective at using memory, so you can use them as part of your debugging analysis without having any negative effects on your hardware.
16. PurifyPlus
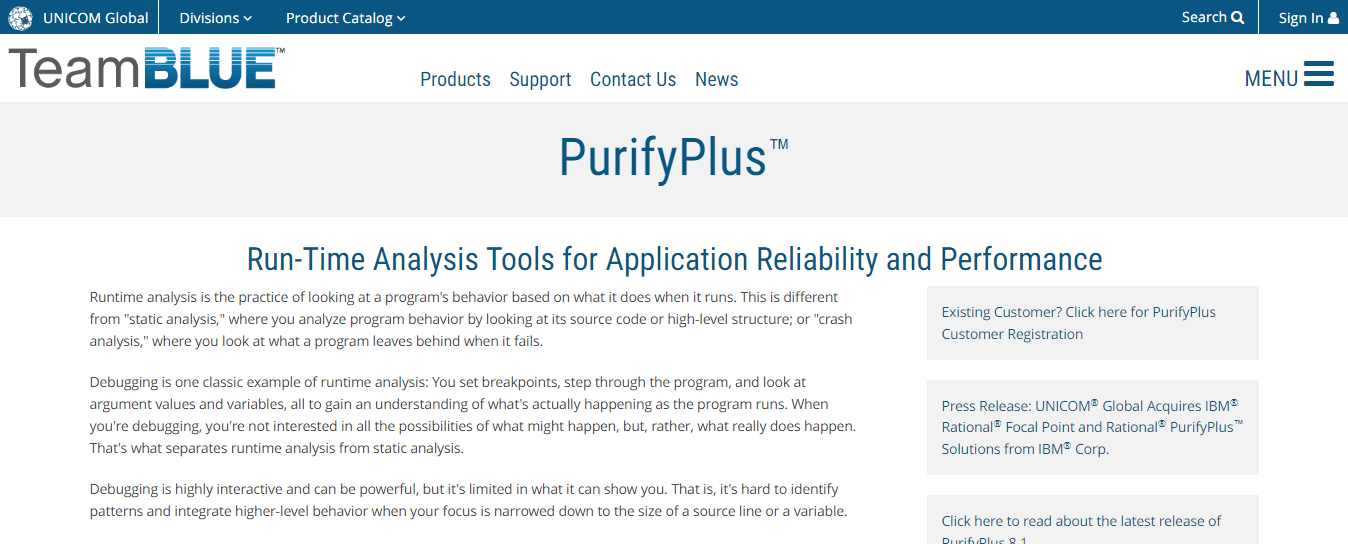
A tool for run-time analysis is PurifyPlus. This implies that it keeps track of the system while it is being used, monitoring CPU usage and any other potential application bottlenecks.
So how does PurifyPlus debugging work? Since this is a run-time debugger, you can see the problem as it arises rather than attempting to duplicate and debug it after it has already happened. As a result, you may leave PurifyPlus running on your server to monitor your systems and provide you with insightful analytics as needed.
15. WinPdb
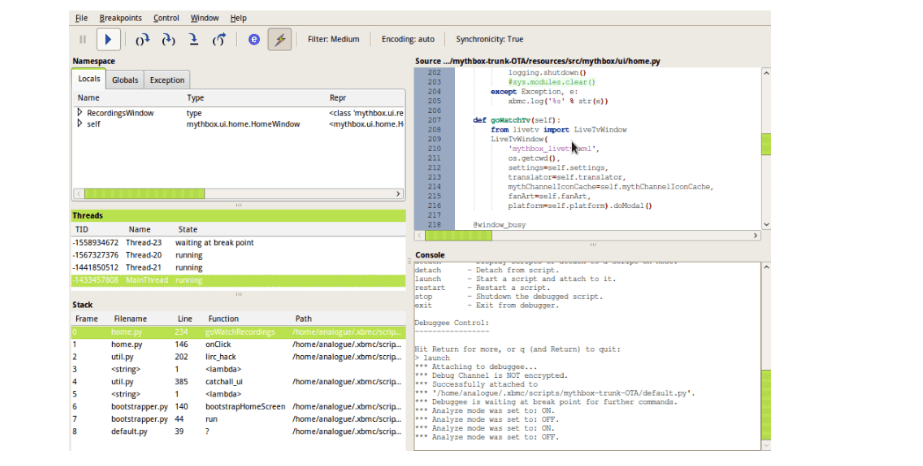
An outstanding Python debugger that runs well on Windows, Mac OS, and Linux computers is WinPdb. Both Python 2.x and Python 3.x are compatible with it.
Smart breakpoints, namespace changes, multiple threads, embedded debugging, and encrypted communication are supported by this debugging tool. The command-line debugger for Winpdb, rpdb2.py, must be copied to the remote machine in order to perform remote debugging.
Once complete, launch the debugger on the remote system and launch the Python script. Launch the GUI and attach the script to debug from your local device. You can now utilize the script’s basename or complete path as it appears on the remote device.
14. Valgrind
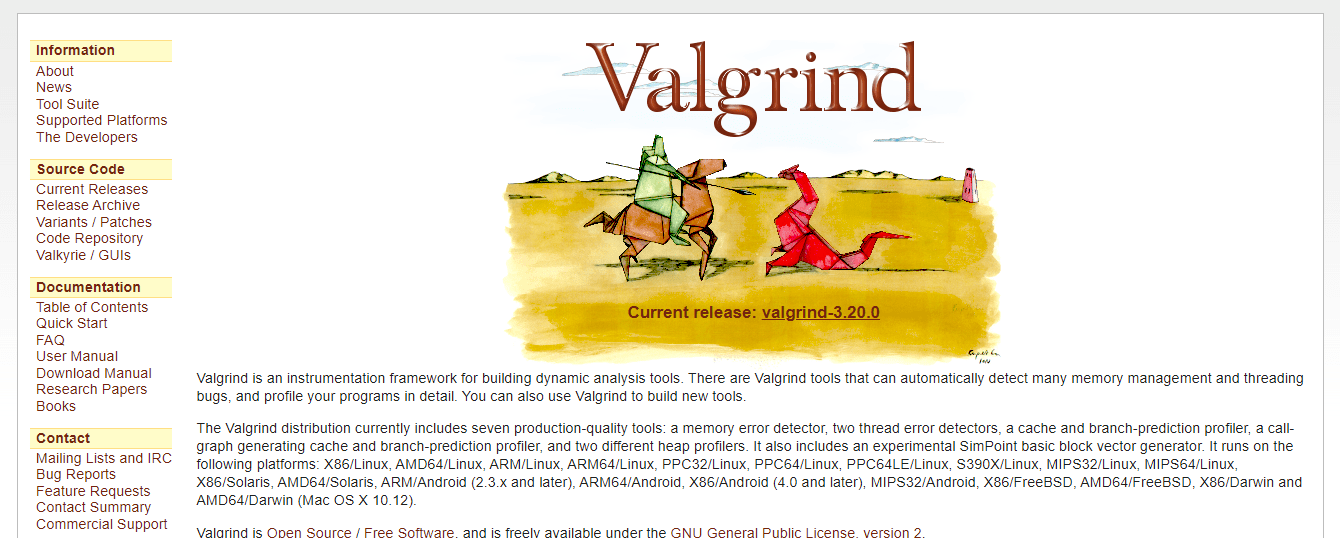
A debugging tool called Valgrind profiles your software on both the hardware and software levels while focusing on memory management.
It keeps track of how your software uses the hardware, making memory leaks easier to find and address. It can take the form of overlapping source and destination memory blocks, stray uninitialized values, mismatched frees, heap blocks, and memory assignment tracking.
The benefit of Valgrind is that it is open-source software, which makes it cost-free to use and incorporate into live servers. A side of Android is supported for mobile hardware debugging, along with a variety of Linux-based platforms.
A professional IDE that enables editing, testing, debugging and other functions for PHP code is called Zend Studio. Since it is intimately connected with the Zend Server, a complete PHP environment is created, making it simpler to analyze issues found in staging and production settings.
In order to debug PHP scripts, Zend also offers a PHP extension that customers can install on web servers. It’s not very difficult to use Zend for debugging; all you have to do is open the source code, create breakpoints in the project, and launch a debug session.
12. Ghidra
Ghidra is a free program that the NSA originally developed that enables you to decompile software back into its original source code. It is an SRE framework with comprehensive features and code-mining capabilities.
This is a unique tool since it can assist you in tracking down vulnerabilities in your systems’ defenses against malware and harmful code that may have gotten inside.
Ghidra is a different kind of debugging tool. Through the processes of disassembly, assembly, decompilation, graphing, and scripting, it can be utilized as a source tracking tool.
11. Eclipse

Eclipse is a renowned IDE for Java development that also supports languages like Python, Ruby, C#, and, PHP. The Eclipse IDE is equipped with advanced features for development and debugging, making it an all-rounded tool.
One of the most impressive features of Eclipse is the platform’s debug perspective which shows detailed debugging information such as breakpoints, variables, call stacks, and threads side by side.
With Eclipse, you can inspect values, suspend and resume threads, evaluate expressions, and step through program execution. Eclipse makes it simple and easy to manage remote debugging configurations, which increases the tool’s popularity among developers.
10. GDB
GDB can be used to debug software on different computers. You must launch the GDB tool on the host system in order to do remote debugging. In order for the two programs to communicate with each other via the GDB remote serial protocol across a network or serial line, gdbserver must also be running on the target system.
GDB/gdbserver offers two configuration options for remote debugging. The first method entails automatically building and uploading application code to the remote machine using the remote GDB server.
Utilizing GDB remote debug, where you should already have the executable files, is the second option.
A piece of software called Interactive Disassembler, or IDA, enables you to convert machine-executable code back into assembly language source code. Debugging applications that have already been compiled and may not have direct access to the source code may benefit from this.
The most recent features and functionalities are all included in IDA Pro, the paid version of Interactive Disassembler. Older versions are freely accessible.
With IDA, you can trace parameters, cross-reference code sections, and track API calls without having to continuously compile code. Instead, you have access to certain data sections and can rename, annotate, and add information to certain lines of code without having to restart the system each time you wish to add a log.
08. PyCharm
JetBrains created PyCharm, another capable IDE for Python. This clever code editor has remote development tools, allowing it to execute, test, debug, deploy, and operate apps on remote hosts and virtual computers.
The debugger includes a debug console, a number of breakpoints, a frames view, watches, stepping modes, and remote interpreters.
Innovative auto-completion, strong refactoring assistance, and seamless connection with tools like Django, IPython, Docker, Vagrant, and Pytest are just a few of PyCharm’s outstanding features.
PyCharm is also a fantastic cross-platform development tool. JavaScript, Cython, CoffeeScript, TypeScript SQL, HTML/CSS, Node.js, AngularJS, and more are supported in addition to Python.
07. RubyMine
RubyMine is a robust and perceptive cross-platform IDE that enables you to debug a variety of programming languages, including Ruby on Rails, CoffeeScript, JavaScript, CSS, ERB, and HAML. You may easily specify hit conditions and set breakpoints using its sophisticated built-in debugger.
There are two methods for debugging applications that run on distant devices in JetBrains’ RubyMine. You can start your debugging session after adding the remote Ruby interpreter and setting up mappings between local and remote project files.
As an alternative, you might start running programs on the remote device before adding the Ruby interpreter.
After that, set up file mappings and bind to an active process. When debugging an application that you are unable to launch directly from your IDE, the latter is especially useful. This tool’s ability to launch multiple debug processes concurrently is another fantastic feature.
06. Fusion Reactor
A tool for multi-channel alert integration, continuous monitoring, profiling, and live debugging is called Fusion Reactor. It has a comprehensive feature set that can make finding bugs, leaks, and spikes easier and faster.
The ability to track and trace logs in real-time is made possible by live debugging, which makes it simpler to see code stacks as they execute. We frequently have to stop the function while debugging in order to analyze what is happening. Depending on how it’s done, this could alter the results and enable the bug to elude detection.
Java and ColdFusion-specific error pointing is available in Fusion Reactor, and non-blocking breakpoints can be placed in the code to generate a complete stack trace report. This entails that server processes can continue as you monitor, watch, track, and trace. Finding the root of the problem may depend on your ability to debug without interruptions if you have distributed systems or use a microservice design.
Every developer who works with .NET always favours Visual Studio Code. It includes many features that make local and remote debugging easy. You can create conditional breakpoints and log points using this tool.
You may also inspect variables with it. The VS Code Remote Development Extension Pack must be installed in order to perform remote debugging. Three extensions included in this package give you everything you need to start, track, and speed up your remote debugging loop.
04. Lightrun
You can test and diagnose your microservices, Kubernetes clusters, Docker swarms, and Amazon web services with Lightrun, a server-side debugger.
Lightrun is unique in that debugging is possible directly on the service while it is in use and in real-time. There is no need to attempt replication or set up mirror servers to address the issue. Deploying Lightrun doesn’t require any downtime, which helps keep the flaw or problem in its original state.
Developers benefit from this since it saves us time by providing the information we require when we require it while preventing service interruptions. The debugging tools provided by Lightrun allow you to add metrics, snapshots, and log lines from your IDE. With Lightrun, you can debug your live server without causing it to go down.
03. Rookout
A tool called Rookout makes the debugging process more agile. It can be used to debug serverless and containerized apps’ JVM, Node.JS, and Python code.
The brilliance of Rookout is in its capacity to swiftly and securely enable users to troubleshoot both staging and production applications. By giving all the information required in a matter of seconds, it does away with the drawn-out and challenging debugging methods.
Because Rookout offers on-demand data, developers can understand and troubleshoot code-related problems without having to change their applications, deploy them again, or restart them.
You may remotely debug active Electron apps with Rookout. Developers can set non-breaking breakpoints in troublesome Electron apps thanks to Rookout’s shareable interface.
The tool gives you total insight into how well your app is performing, allowing you to identify problems and create the necessary fixes. All of this is made possible by Rookout without the end user having to install any additional software.
02. Microsoft Console Debugger Tool
You can always view what your machine is doing thanks to the Microsoft Console Debugger application. You may use it to debug your code, go line by line through it, and even observe variables change throughout the course of a program as you run it.
The Console Debugger’s nice feature is that it doesn’t consume any memory on your computer, so it’s always available when you need it. Its limitation to Visual C++ programs created in C++ Builder or Visual C++ is a drawback.
The main benefit of GBD is that remote debugging is possible. For instance, a server may flicker out while you are managing an orchestration of servers. You need to look inside because you’re unsure of the reason. GBD enables you to test your local debugger against the remote machine’s running program. The debugging tools allow you to set inspection breakpoints, step through processes, and watch variables.
There is no graphical user interface for the GDB. While this may appear strange in comparison to more contemporary debuggers, GDB operates on the command line, which is aligned with the languages the GNU Debugger supports and is a familiar environment for many engineers working on server-side and backend projects.
This was about “Debugging Tools For Software Engineers“. I hope this article may help you all a lot. Thank you for reading.
Also, read:
- Visually Explained MISRA Guidelines
- Python Isn’t Running Your AI — C++ and CUDA Are!
- NVIDIA PersonaPlex-7B: The Breakthrough That Brings Open-Source AI to Human-Speed Conversations
- LLM vs RAG: From Trained Intelligence to Document-Aware AI
- 100+ Indian Startups & What They Are Building
- Top 20 Indian Government Hackathons In 2026
- How NVIDIA Courses Are Powering 50 LPA Careers: A Complete Guide to 100+ Learning Paths in AI, GPUs, and the Future of Tech
- Top 15+ Technology & Engineering Expos To Attend In 2026 (India)