Hello guys, welcome back to our blog. In this article, we will discuss the data analytics life cycle, all stages involved while processing data, how businesses can grow by analyzing the data, and a lot more things we will discuss in this article.
If you have any electrical, electronics, and computer science doubts, then ask questions. You can also catch me on Instagram – CS Electrical & Electronics.
Also, read:
- Tools For SEO Search Engine Optimization, How To Do SEO.
- What Is Time Complexity And Space Complexity Algorithm With Example?
- High Salary Engineering IT Jobs, Companies Paying Huge Money.
Data Analytics Life Cycle
What Is Data Analytics?
Analytics is a wider term that encompasses analysis. Data analytics involves the control of the complete data lifecycle including collecting, cleaning, preparing, storing, analyzing, and overseeing data. Includes the development of processes that allow data analysis to occur through the usage of extremely scalable distributed technologies and frameworks that are proficient in analyzing large volumes of data from various sources.
Data analytics allow data-driven decision-making so that decisions can be based on actual data and not only on past experience or intuition. There are four general kinds of analytics that are specified by the results they produce:
- Descriptive analytics
- Diagnostic analytics
- Predictive analytics
- Prescriptive analytics
Big Data analysis differs from conventional data analysis originally due to the volume, velocity, and variety of characteristics of the data being treated. The Big Data analytics lifecycle is divided into nine stages:
Data Analytics Life Cycle
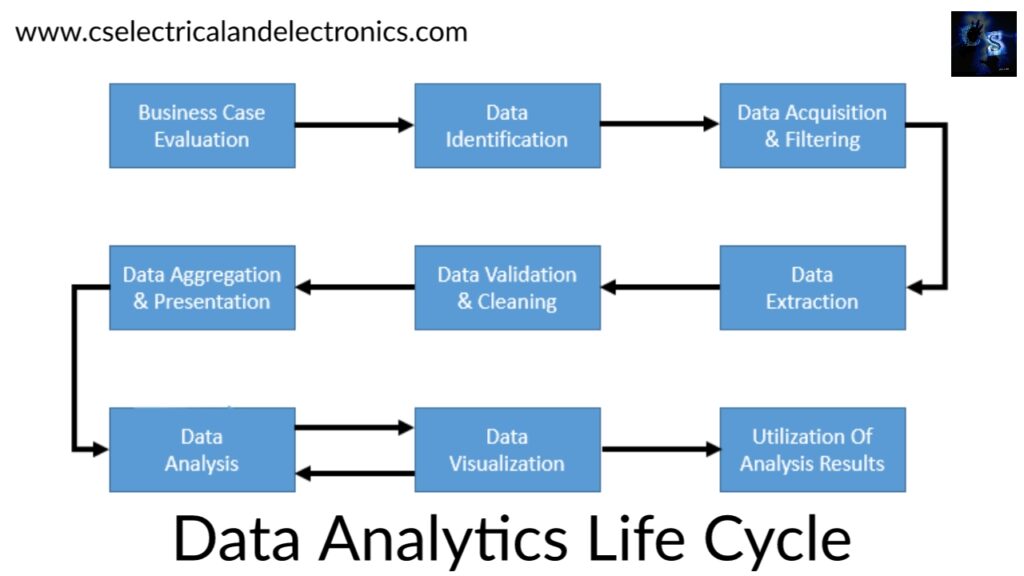
01. Business Case Evaluation
Offers a clear understanding of the support, motivation, and goals of carrying out the analysis. Claims that a business case is created, assessed and approved previous to proceeding with the actual hands-on analysis tasks. This evaluation of the business case benefits understands the business resources that will require to be utilized and which business challenges the analysis will stop.
Identification of KPIs through this stage can help manage assessment criteria and direction for the evaluation of the analytic results. If KPIs are not immediately available, make the goals of the analysis project SMART (Specific, Measurable, Attainable, Relevant, Timely).
Decided whether the business problems being discussed are really Big Data problems. –In order to fit as a Big Data problem, a business problem requires to be immediately related to one or more of the Big Data aspects of volume, velocity, or variety.
Manage the budget needed to carry out the analysis project. Any needed purchase, such as tools, hardware, and training, must be known in advance. Estimate the anticipated investment against the proposed benefits of reaching the goals.
02. Data Identification
Knowing the datasets needed for the analysis project and their sources. Recognizing a wider kind of data source may enhance the possibility of finding hidden patterns and correlations. Depending on the business range of the analysis project and the nature of the business problems being addressed, the needed datasets and their sources can be internal and/or external to the company.
In the case of internal datasets, a list of available datasets such as data marts and operational systems, are typically compiled. In the case of external datasets, a list of possible third-party data suppliers, such as data markets and publicly available datasets, is compiled.
03. Data Acquisition And Filtering
Data is collected from all of the data sources that were recognized during the previous stage. The collected data is then subjected to automated filtering for the elimination of corrupt data or data that has been considered to have no value to the analysis objectives. Depending on the type of data source may need API integration, such as with Twitter.
Data that is separated out for one analysis may possibly be helpful for various types of analysis — it is desirable to store a copy of the initial dataset before moving with the filtering. For batch analytics, the data (both Internal and External) is persevered to disk prior to analysis. – In the case of real-time analytics, the data is analyzed first and then persevered to disk.
Metadata can be attached via automation to data to enhance the analysis and querying. These benefits maintain data origin throughout the Big Data analytics lifecycle, which serves to establish and maintain data accuracy and quality.
04. Data Extraction
Some of the data recognized may arrive in a format unsuitable with the Big Data solution. Different types of data are more possible with data from external sources. Extract diverse data and transform it into a form that can be used for the purpose of the data analysis. The amount of extraction and transformation needed depends on the types of analytics and capacities of the Big Data solution.
For example: extracting the needed fields from delimited textual data, such as with web server log files, may not be needed if the underlying Big Data solution can already directly prepare those files.
One more example: Extraction of comments and a user ID embedded within an XML document without the requirement for further transformation.
05. Data Validation And Cleaning
Wrong data can skew and distort analysis results. Data input into Big Data analyses can be disorganized without any evidence of validity. Its complexity can more make it difficult to come at a set of proper validation constraints. This phase sets often complex validation rules and eliminates any known wrong data.
For batch analytics – data validation and cleansing can be done via an offline ETL operation. For real-time analytics – a more compact in-memory system is needed to verify and cleanse the data as it comes from the source. Provenance can play an important role in deciding the accuracy and worth of questionable data. Data that seems to be invalid may still be valuable in that it may hold hidden patterns and trends.
06. Data Aggregation and Representation
Integrating various datasets together to arrive at a combined view. Data may be dispersed across various datasets, claiming that datasets be joined together via common fields. Example: date or ID. Related data fields may appear in multiple datasets. Example: date of birth. Hence, a method of data reconciliation is needed or the dataset representing the correct value requires to be determined. Can become complicated because of variations in
- Data Structure – Although the data format may be the same, the data model maybe another.
- Semantics – A value that is labeled separately in two different datasets may mean the same thing,
Example: “surname” and “last name.”
Same data can be stored in many different forms. One form may be better suited for a particular type of analysis than another.
For example – data stored as a BLOB would be of little use if the analysis requires access to individual data fields.
Data aggregation is where two datasets are aggregated together using the Id field.
07. Data Analysis
Typically includes one or more types of analytics. Iterative in nature, particularly if the data analysis is exploratory; The analysis is reproduced till the proper pattern or correlation is uncovered. It can be as easy as querying a dataset to compute an aggregate for comparison. Or as challenging as joining data mining and complex statistical analysis techniques.
08. Data Visualization
Used to graphically demonstrate the analysis results for effective analysis by company users. Present users with the ability to make visual analysis, allotting for the discovery of answers to questions that users have not yet even formed. The same results may be performed in a number of various ways, which can change the presentation of the results. Use the most proper visualization technique by keeping the business domain in context.
09. Utilization Of Analysis Result
Committed to determining how and where prepared analysis data can be further leveraged. Typical areas that are investigated during this stage include:
Input for Enterprise Systems –data analysis outcomes may be automatically or manually fed directly into company systems to improve and optimize their operations and performance. Business Process Optimization – The known patterns, correlations, and anomalies identified during the data analysis are utilized to refine business processes. Alerts – Data analysis results can be utilized as input for existing alerts or may form the basis of new alerts.
This was about the data analytics life cycle. I hope this article may help you all a lot. Thank you for reading.
Also, read:
- 100+ C Programming Projects With Source Code, Coding Projects Ideas
- 100+ Indian Startups & What They Are Building
- 1000+ Automotive Interview Questions With Answers
- 1000+ Interview Questions On Java, Java Interview Questions, Freshers
- 2026 Hackathons That Can Change Your Tech Career Forever
- App Developers, Skills, Job Profiles, Scope, Companies, Salary
- Applications Of Artificial Intelligence (AI) In Renewable Energy
- Applications Of Artificial Intelligence, AI Applications, What Is AI